2024 Economic Impact Study
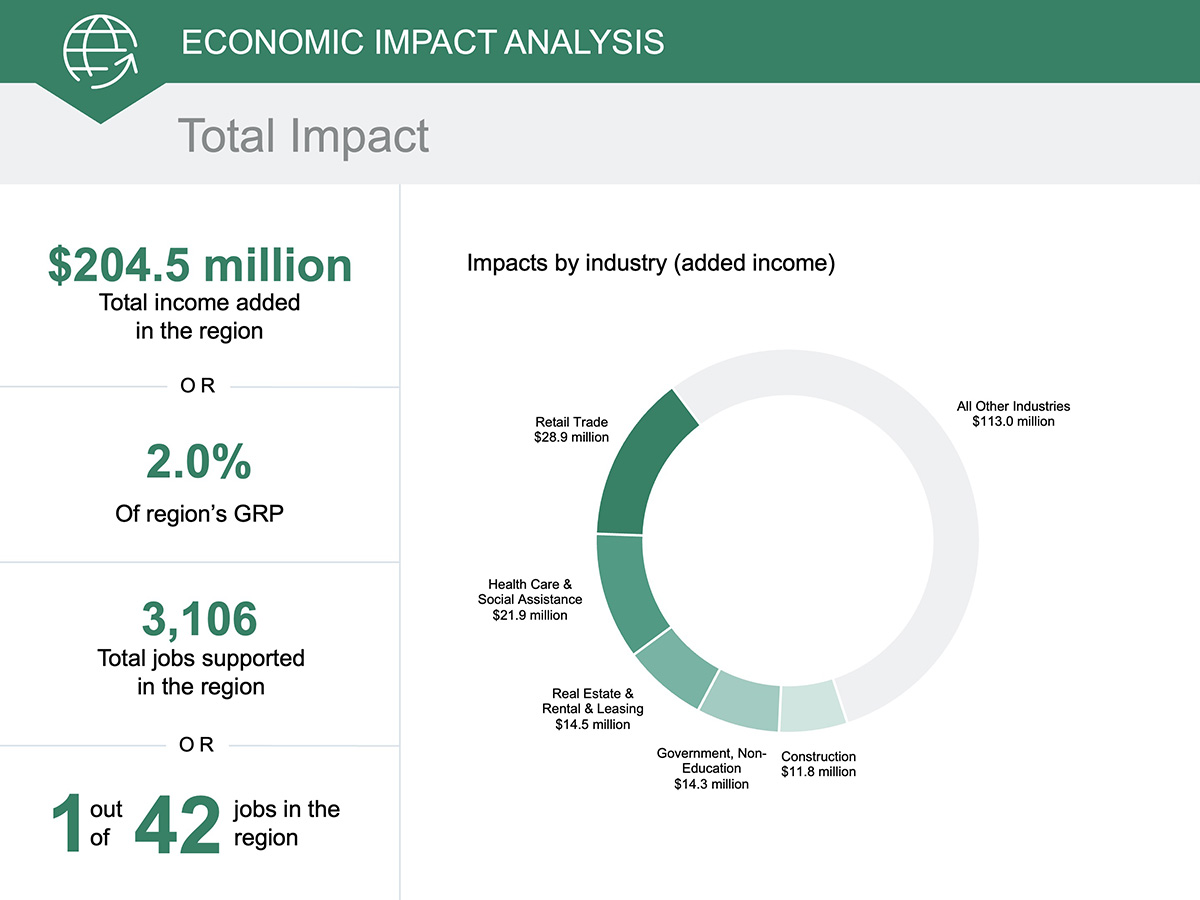
The additional income of $204.5 million created by NMC is equal to about 2% of the total gross regional product of the NMC Service Area. NMC creates a positive net impact on the regional economy and generates a positive return on investment for students, taxpayers, and society, according to a 2024 study by Lightcast. Results of the analysis reflect fiscal year (FY) 2021–22 and the college's impact on the NMC Service Area of Antrim, Benzie, Grand Traverse, Kalkaska, Leelanau and Wexford counties.
During the analysis year, NMC spent $30.4 million on payroll and benefits for 672 full-time and part-time employees and spent another $23.8 million on goods and services on day-to-day and construction operations. This initial spending creates more spending across other businesses throughout the regional economy, resulting in the commonly referred to multiplier effects. This analysis estimates the net economic impact of NMC that directly accounts for the fact that state and local dollars spent on NMC could have been spent elsewhere in the region if not directed toward NMC and would have created impacts regardless.
For every tax dollar spent educating students attending NMC, taxpayers will receive an average of $1.40 in return over the course of the students’ working lives. This analysis shows that in fiscal year (FY) 2021-22, operations and student spending of NMC, together with the enhanced productivity of its alumni, generated $204.5 million in added income for the NMC Service Area economy. The additional income created by NMC is equal to about 2.0% of the total gross regional product of the NMC Service Area. The impact is equivalent to supporting 3,106 jobs. For further perspective, this means that one out of every 42 jobs in the NMC Service Area is supported by the activities of NMC and its students.
 Operations spending impact
Payroll and benefits to support NMC’s day-to-day operations amounted to $30.4 million. The college’s non-pay expenditures amounted to $23.8 million, $12.1 million of which was spent directly in the NMC Service Area. The net impact of operations spending by the college in the NMC Service Area during the analysis year was about $37.4 million in added income, which is equivalent to supporting 749 jobs.
Student spending impact
Around 14% of students attending NMC originated from outside the region. Some of these students relocated to the NMC Service Area to attend the college. In addition, some students are residents of the NMC Service Area who would have left the region if not for the existence of NMC. The money that these students, referred to as retained students, spent toward living expenses in the NMC Service Area is attributable to NMC.
The expenditures of relocated and retained students in the region during the analysis year added about $3.2 million in income for the NMC Service Area economy, which is equivalent to supporting 51 jobs.
Alumni impact
Over the years, students gained new skills, making them more productive workers, by studying at NMC. Today, thousands of these former students are employed in the NMC Service Area.
The accumulated impact of former students currently employed in the NMC Service Area workforce amounted to $163.9 million in added income for the NMC Service Area economy, which is equivalent to supporting 2,305 jobs.
 View/download the full report here
View/download fact sheets on individual counties here: